Original info from here: http://cimss.ssec.wisc.edu/sage/remote_sensing/lesson2/activities.html
1.To the right is a visible image where the satellite radiometer collected reflected energy from the visible part of the electromagnetic spectrum, or 0.6 microns. You can change the appearance of the extracted section by changing the cloud thickness or the surface characteristics. Click on the image to the right to begin the activity.
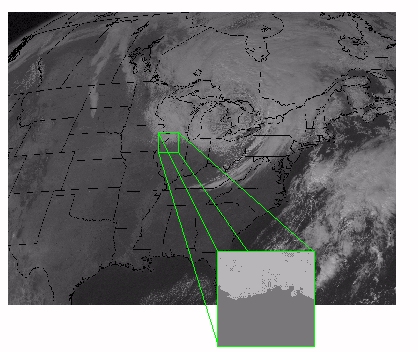
1) the thicker clouds are, the lower Tb is.
2) the warmer surface( snow/ice, crops, forest, ocean --> warmer ), the bigger Contrast between cloud and surface characristics
2. The image to the right is an infrared (IR) image (10.7 microns) from a radiometer sampling the IR section of the electromagnetic spectrum. This is typical of the images you see on the TV weather. You can change the appearance of the extracted section by changing the cloud altitude (and its associated ambient air temperature) or the surface temperature. Click on the image to the right to begin the activity.
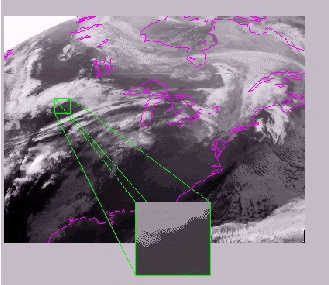
1) the higher cloud altitude, the lower Tb.
2) the higher Ground temperature, the bigger Contrast between cloud and surface
3. This image is from the water vapor (near-infrared or 6.7 microns) section of the electromagnetic spectrum, where the atmosphere is largely opaque to radiation. For this reason, water vapor images supply information about the top of the atmosphere. Click on the image to the right to explore how cloud altitude and upper tropospheric humidity alter the appearance of water vapor
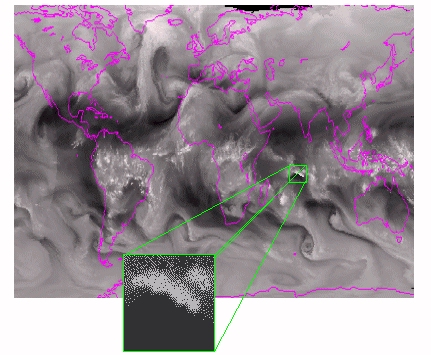 imagery.
1) the higher cloud altitude, the lower Tb,
2) the lower "upper tropospheric relative humidity", the bigger Contrast between cloud and upper troposphere.
No comments:
Post a Comment